Total.js UI Studio is an open-source Total.js application that merges a Total.js UI Builder for creating reusable components with a Total.js Flow - Visual Programming Interface for connecting designs and processing their data.

This solution is part of the Total.js Enterprise service and available for paid customers.
From UI design to complete data processing.
Easily extend the Total.js UI Studio without touching the source code.
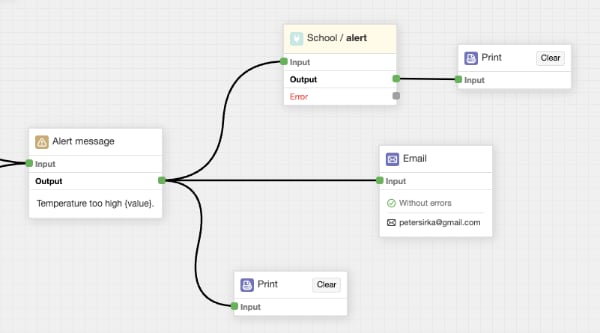
A Visual Programming Interface is included in the app.
This solution stores data in the file system.
Packed with powerful features for everyday use.
The application has included Total.js UI Builder Engine for creating rich user interfaces with an internal component database.
Build custom component library with unique looks or behaviors, directly within the UI Studio.
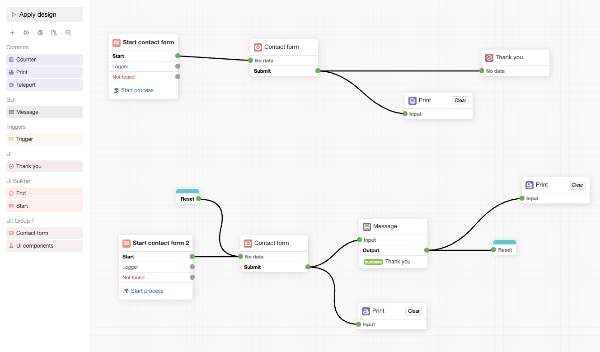
A built-in Visual Programming Interface powers your UI, allowing you to wire display logic and process incoming data in one place.
Send your data anywhere - save it to a database or push it to external servers with a single step.
Create your own component libraries inside UI Studio and tweak their source code without leaving the app.
They can cover all kinds of functionality, from visual components like charts to form elements such as textboxes, checkboxes, or full address fields.
Good to know
The application comes with over 40 prebuilt UI components ready to use.
Every process designed in UI Studio can be used in 3rd-party applications through our client-side j-UIStudio component - just copy the process link and run it outside of UI Studio.
<!-- EXAMPLE -->
<ui-component name="uistudio" config="url:https://youruistudio.com/ui/imaasiby1/"></ui-component>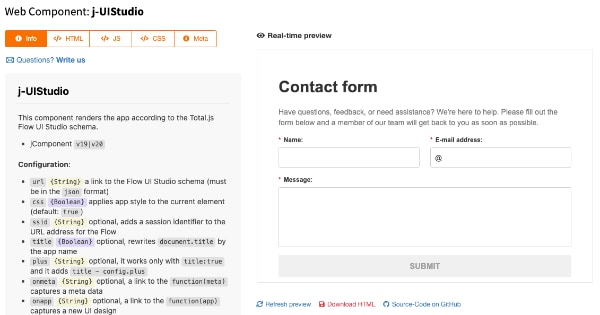
You don’t have to use a single UI Studio instance for everything - create as many as you need for different use cases. UI Studio is a truly lightweight app.