
Build fully customizable dashboards from your PostgreSQL data, combining multiple reports and 10+ chart types into clear, interactive views that help your team see the bigger picture.
This solution is part of the Total.js Enterprise service and available for paid customers.
Turn SQL queries into clear data grids and charts.
Easily extendable through the Total.js plugin system.
The Dashboard includes over 10 chart types.
Total.js Dashboard is powered by PostgreSQL.
Packed with powerful features for everyday use.
Total.js Dashboard is a lean, open-source app for turning PostgreSQL data into dashboards. It ships with OpenReports built in, so you can query data and present it clearly with tables and charts. Source code is available via the Total.js Enterprise GitHub repository.
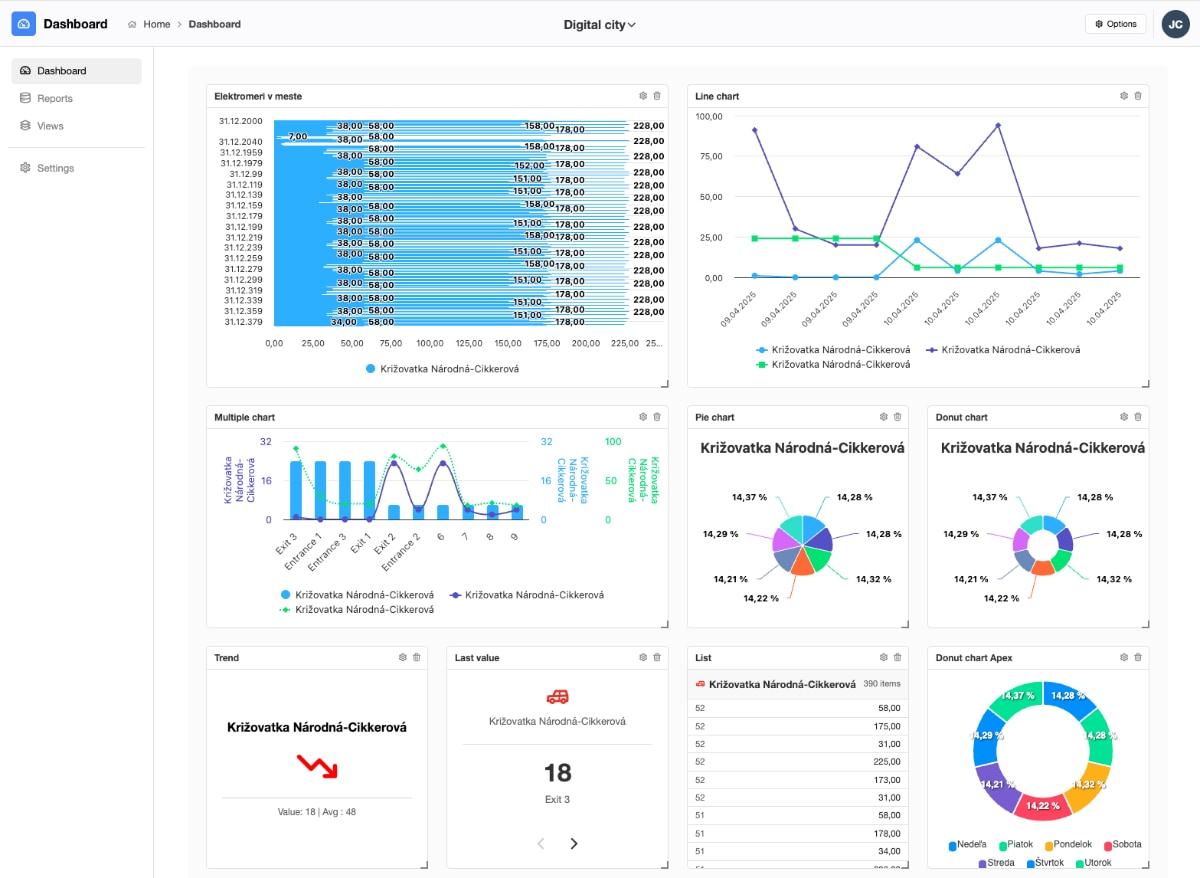
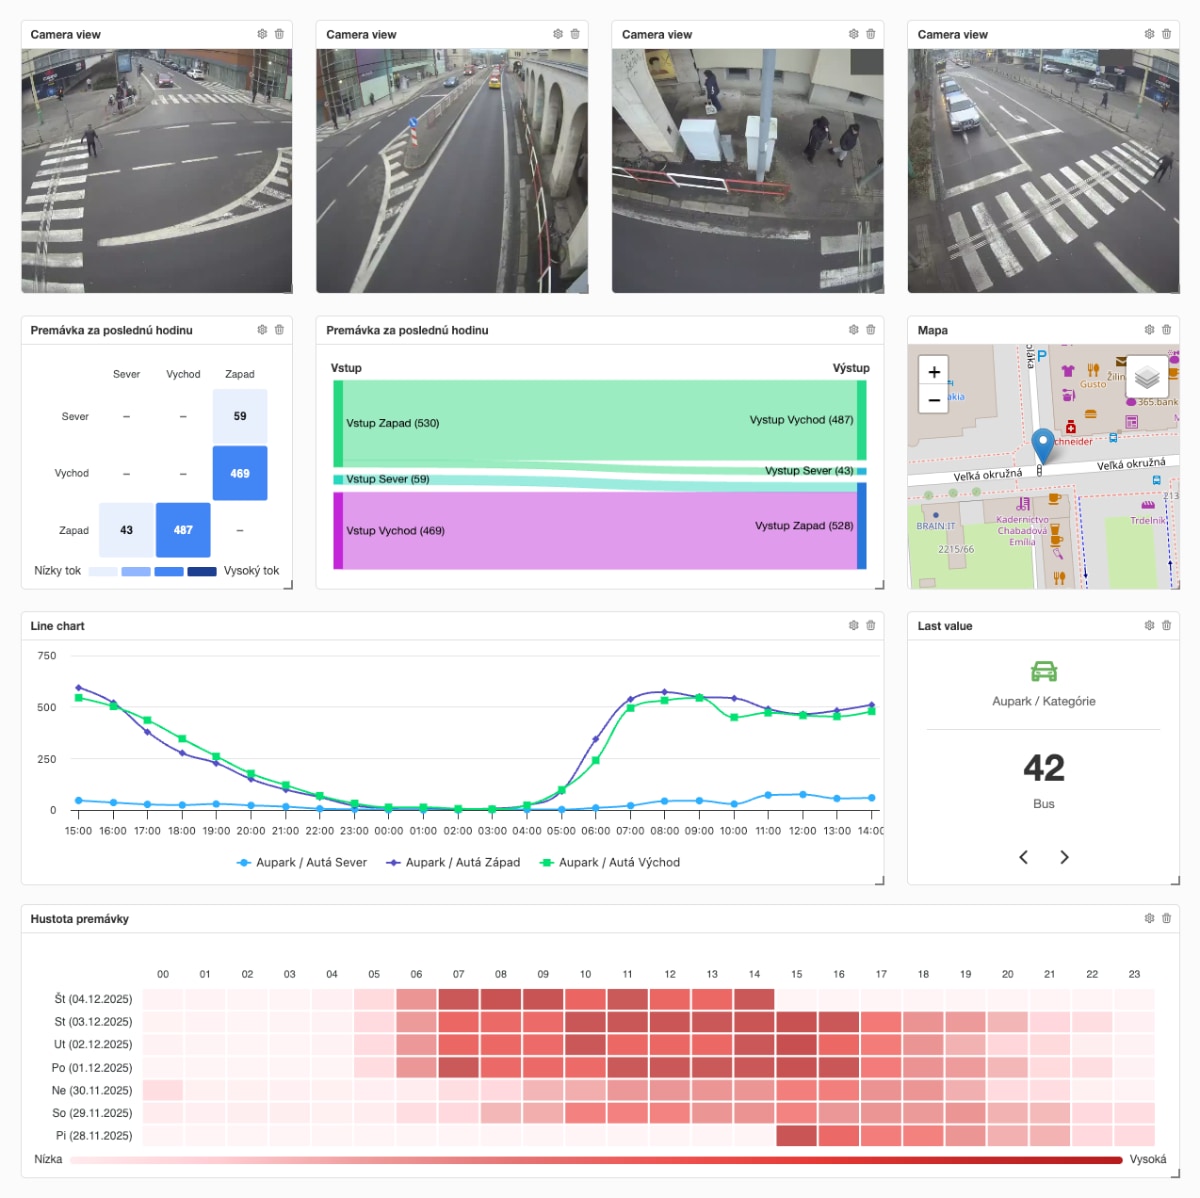
Create custom dashboards with a variety of chart types. The initial release comes packed with 10+ different chart types - from simple bars and lines to more advanced visualizations. Combine multiple reports on a single screen and turn your PostgreSQL data into clear, interactive dashboards in minutes.
The Dashboard app isn’t just about dashboards - it also gives you direct views into your data. With interactive reports, you can browse results, apply filters, drill down into details, and export data with a single click. Perfect for exploring your PostgreSQL data before turning it into visual dashboards.
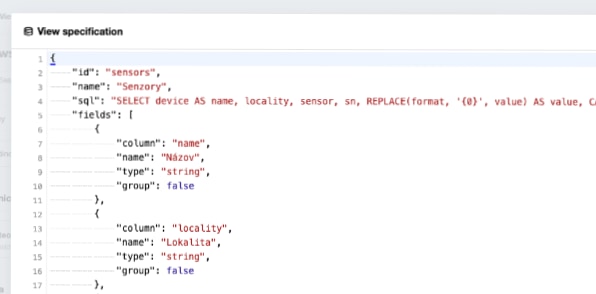
Views are the backbone of your reports and charts. Each view is a clean SQL query that defines how data is fetched from PostgreSQL. Create reusable views once, and build multiple reports and visualizations on top of them - keeping your data logic consistent and centralized.
Total.js IoT Platform + Total.js Dashboard