We prepared an open-source solution for providing an IoT platform that can handle various cases, like smart cities, industry, or smart metering. Independent and all data is under your control on your servers.
This solution is part of the Total.js Enterprise service and available for paid customers.
The solution contains two main apps, and data is stored in a PostgreSQL database.
The solution can be extended easily via Total.js Plugins. Enjoy predefined plugins.
Real-time data can be additionally processed via Total.js Flow.
This solution uses a clean database structure prepared for charts.
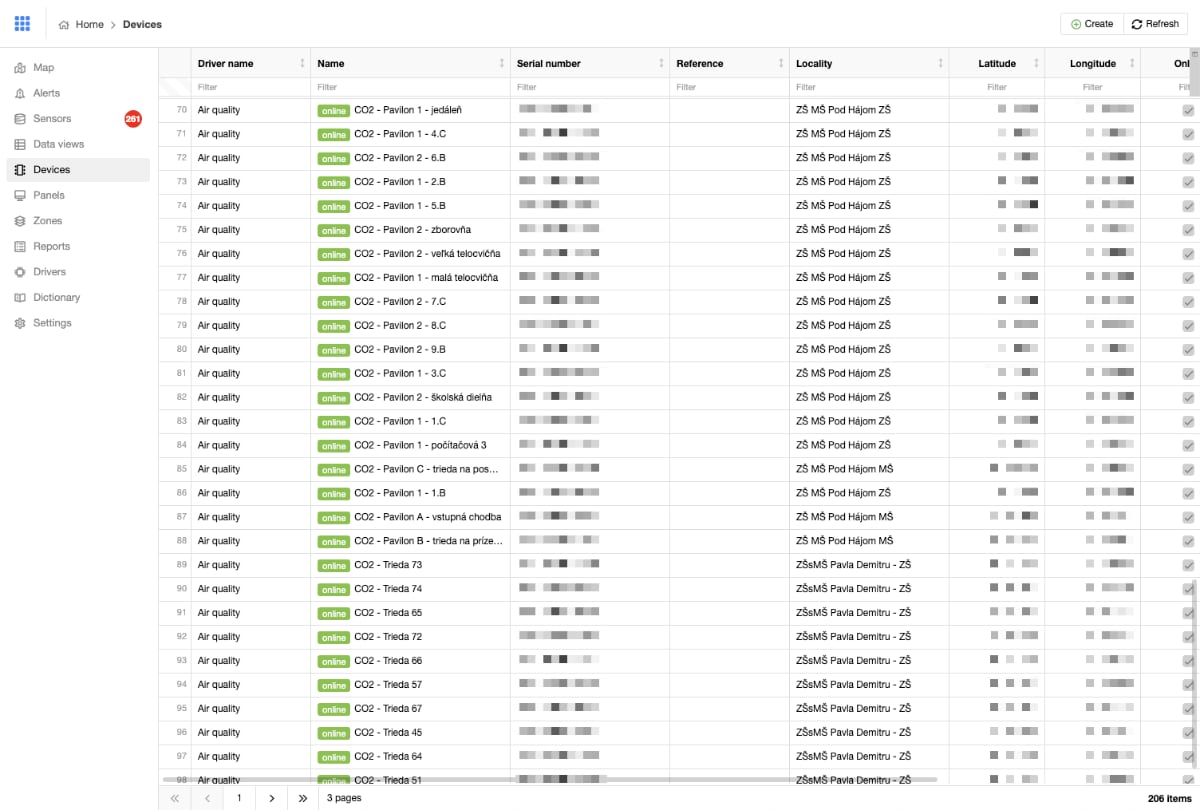
Drivers, device management, alerts, zones, maps, views, sensors, etc..
The Total.js IoT solution consists of two core applications: the Control panel and Streamer.
It's a user interface for managing drivers, devices, zones, alerts, etc. The control panel is integrable with the Total.js OpenPlatform.
This app processes incoming data from the sensors according to the drivers. It's optimized for the best performance.
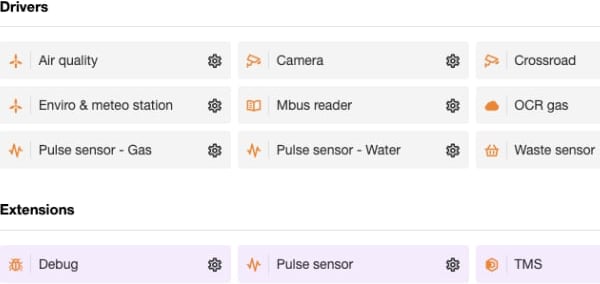
The main logic of the IoT solution is built into drivers. Every device must be linked to a driver.
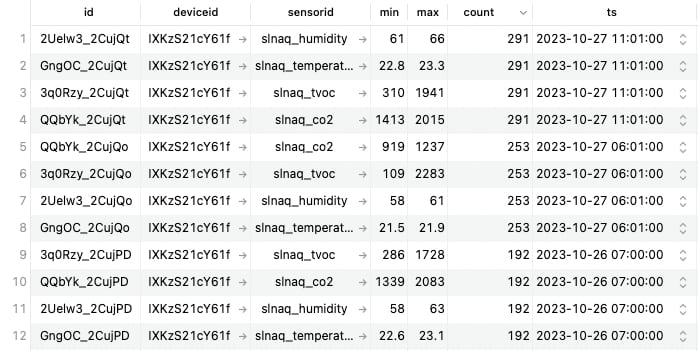
The database schema is designed for the best performance. The database doesn't store every incoming piece of data (if it's not necessary). It contains only processed data divided into minutely, hourly, daily, monthly, and yearly structures.
In the background, drivers are basically Total.js Flow components with updated functionality. They can contain API endpoints or TCP/MQTT/WebSocket connections for processing data from the sensors. Drivers contain predefined functionality for saving data in the PostgreSQL database.
You don't need to solve the problem of storing data and rendering it in the charts. Everything is prepared for easy usage. It's necessary to create your own drivers.
The Total.js IoT Platform allows you to draw and register map zones and assign sensors to them. You can easily choose what sensors or data views you want to see on the map.
The system makes a screenshot of the map automatically with a highlighted zone. So, you or users can easily determine where the zone is located.
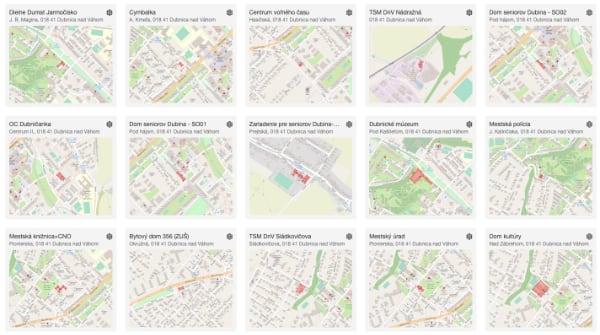
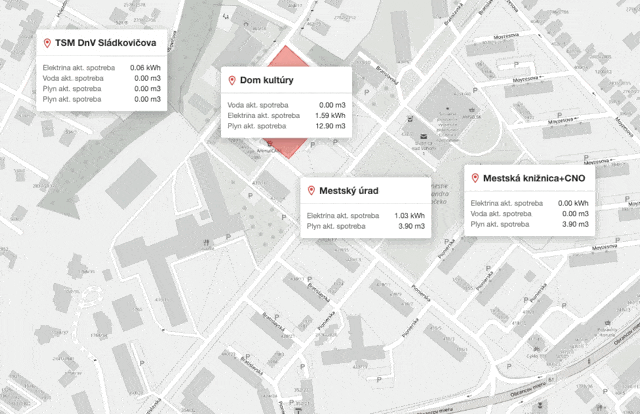
A real-time map renders zones and their devices with sensors. You can see last-measured data, alerts, and advanced stats. Maps support filtering zones and searching devices.
Total.js IoT Platform Map uses the OpenStreetMap engine, and rendering data secures the OpenLayer library.
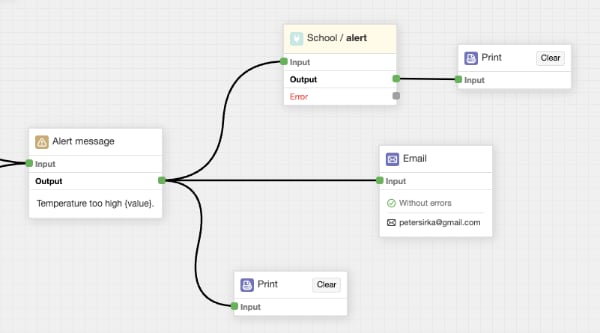
Alerts are automatically created if drivers exhibit unexpected behavior, or you can make alerts dynamically with the help of integrated Total.js Flow. So, you can easily create alerts according to your rules or conditions.
The control panel contains a section "Alerts" with a clear data table. You can search, filter, and sort alerts according to multiple attributes.
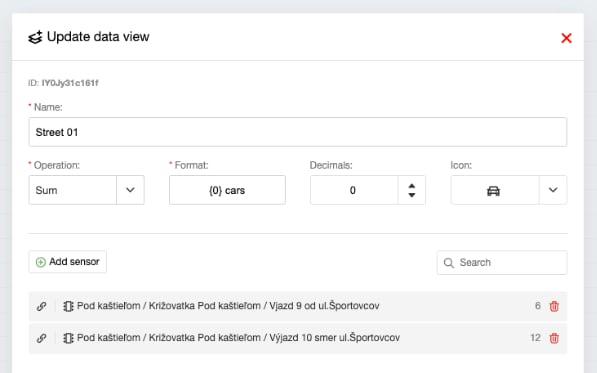
With this functionality, you can accumulate the same data as one cumulative value. The system automatically groups and performs either minimal, maximum, or average operation.
Also, data views can be rendered on the map.